EGR eBook Analytics Dashboard
Project Intro
This post is a summary and overview of a freelance web development project I undertook for eGlobalReader, a language-learning eBook startup. The goal was to create a responsive (in the sense of both screen-size and load speed), easy to use, and attractive dashboard for readers to review their eBook-usage statistics.
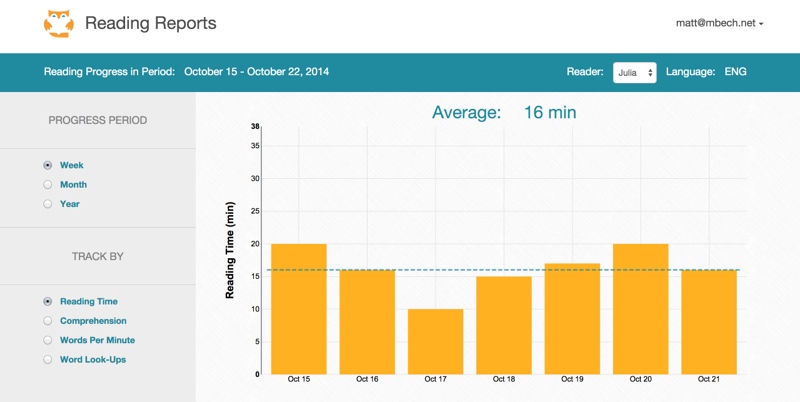
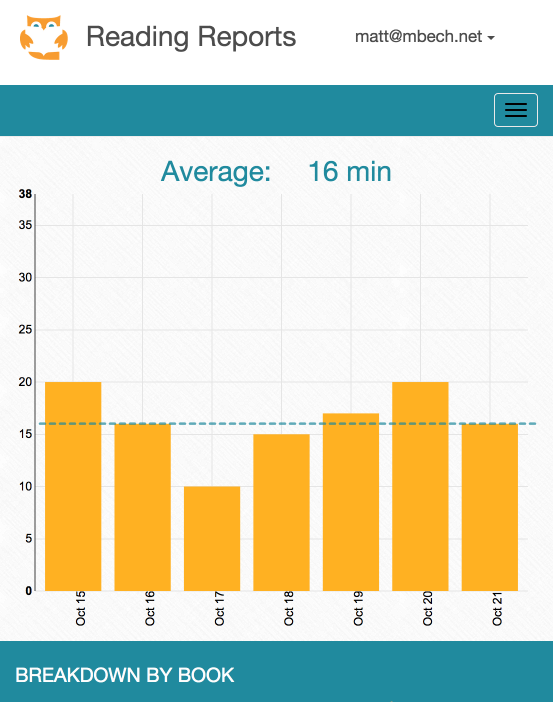
The eventual site isn't live at the moment (and will require login once up and running), so here's a screenshot of the lastest version:
Frameworks, Libraries, and Helpful Tools
My portion was entirely on the front-end, constructed with Javascript, CSS, and HTML, and with the help of the following:
Bootstrap The infamous front-end framework made a great basis for the site design, providing a wide range of standard elements (buttons, dropdowns, etc.) with which to construct the page. Certain aspects of the page (mostly the reading log history table) required quite a bit of fighting against or otherwise circumventing the Boostrap defaults, but overall it was a massive savings in development time and effort.
JQuery This JS library offers a lot of convenience and often a simpler syntax than vanilla JS for DOM manipulation. (Check out You Might Not Need JQuery for some great side-by-side JQuery/pure-JS comparisons). I used it exstensively for all the event bindings throughout the page.
NVD3 A reuseable SVG chart JS library (powered by d3.js). As a large graph was the most prominent component on the page, selecting the right JS graphing library was key. I checked out Raphaël and rickshaw as alternate free charting options, but the appealing default configurations and style of NVD3 won out.
NVD3 certainly takes some getting used to, and with essentially no documentation almost all configuration options need to be discovered from example snippets and comments around the web. "Free of charge" was a requirement at this stage of development, otherwise Highcharts might have been a great option.Sass/SCSS CSS-generating extension that preprocesses SCSS files. Adds a bunch of great functionality to keep styling more concise and easy to maintain. I mostly made use of the variables functionality, which allows you to declare a value and reuse it throughout your SCSS. For example, with colors:
// color bank
//--------------------------------------------------
  $bgDefault      : #fefdfd;
  $bgHighlight    : #EAE9E9;
  $colDefault     : #000000;
  $colHighlight   : #ffb122;
  $egrTeal        : #208A9E;

//and later...
h2{
color: $egrTeal;
}
Visual Design and Interactivity
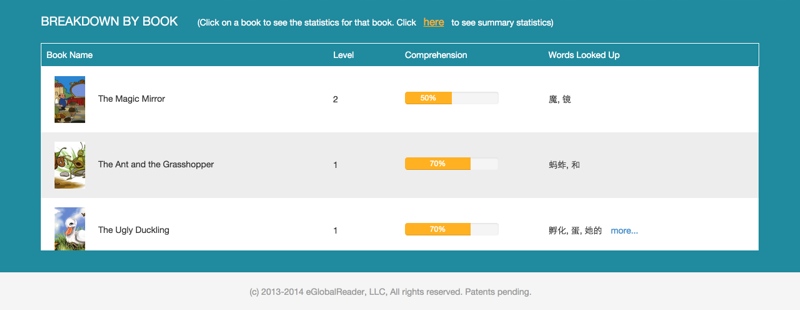
The visual design and styling I coded up were based upon pdf mark-ups provided by one of EGR's founders. Making fairly liberal use of built-in Bootstrap components, with a few adjustments or work-arounds as needed to provide non-standard functionality. The "Breakdown by Book" table at the bottom of the page was one such case, as there's no built-in functionality for scrollable tables with fixed headers. Which is apparently intentional because it's a pain, see discussion here.
JQuery event bindings provided most of the interactive functionality. The various graph data-type and date-range radio buttons would fire off an AJAX request as needed and selectively reload portions of the page (e.g. graph and table contents) with the returned JSON. Making sure the callback on "AJAX success" correctly triggered the required partial page updates/refreshes was pretty tricky, but rewarding once it all clicked. Below are two gifs showing a pair of states for the graph and table.
Graph: data type and date range toggles
Table: individual-book filter (selecting a book-row from the table would restrict the graph data accordingly) and word-lookup expansion toggle
The more/less word-lookup toggle in the far-right column simply used the JQuery toggle() function to show/hide the long or short word strings, both kept directly in the HTML.
Code Organization and Structure
As a custom single page website with a limited scope, I opted not to dive into Angular, Backbone, or other front-end JS frameworks and instead implement a simple MVC pattern from scratch. (More accurately, a _VC pattern, with the server acting as Model).
Functionality was broken up across multiple js files, such as "graphgenerator.js", "serverdatarequests.js", and "tableupdate.js". Breaking up the various tasks into these small modules made it easy to tell where to find certain functionality, which could then be called directly by the Controller or grouped with other View refresh functions as appropriate.
Here's an example from table_update.js, using JQuery to refresh the HTML table based on the most recent server data:
table.refreshRows = function(){
    //wipe out existing rows
    $('#read-log-tbody').empty()

    //add table rows onto page
    var reading_logs = server_response.readers[reader_index].readinglog
    $.each(reading_logs, function(index){
      table.addTableRow(reading_logs[index])
    })
    //etc.
This particular function is an example of using clear naming and a limited effect to pin down exactly what happens upon being called. It also shows some useful basic JQuery (the functions preceeded with the JQuery "$").
In this case, table.refreshRows() would be grouped with other graph and text-refresh functions as part of a general "refresh" function on the View. The View could then be called as needed by the Controller.
The Controller acts as the 'engine' for the page, calling for server data requests and subsequent updates to the state of the page based upon user input.
Responsive (Small-Screen Friendly)
Adjusting the layout of the page to accomodate various screen-sizes was handled by a blend of built-in Bootstrap media-queries with custom behavior at matching breakpoints. At certain Boostrap-defined pixel widths (e.g. < or > 992 pixels), various style changes would trigger to ensure the dashboard could be used easily. Through a lot of trial and error (and time spent with Chrome DevTool's Device Emulator), here's how it turned out for small screens widths:
Not shown here, but NVD3 chart configuration allowed for tooltips on hover/touch which were handy at these smaller screen sizes.
Closing thought
While the project code repository is private/unavailable, hopefully the above summaries and code snippets will give a sense of the analytics dashboard creation process. As I worked through this project, I learned a ton about getting css to do what you want and effectively implementing asynchronous, partial refreshes of data with AJAX, and JQuery DOM manipulation.